The prevailing narrative in the current market cycle suggests that “this time is different.” As institutional adoption influences Bitcoin’s supply and demand dynamics, many analysts propose that the exuberant blow-off tops characteristic of previous cycles will not materialize. Instead, there is an expectation that institutional investments and exchange-traded funds (ETFs) will stabilize volatility, replacing reckless fervor with a more mature market approach. Yet, is this assertion valid?
Market Sentiment Shapes Institutional Behavior
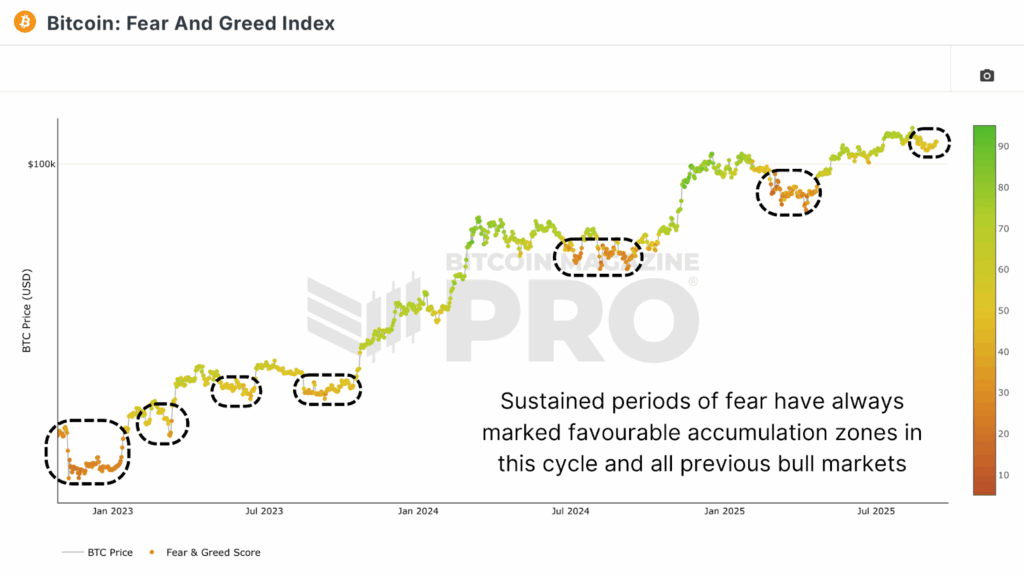
Skeptics frequently dismiss sentiment analysis tools, such as the Fear and Greed Index, as overly simplistic, arguing that they fail to capture the complexities of institutional trading behaviors. However, to disregard sentiment overlooks a crucial reality: institutions are ultimately comprised of individuals who are subject to the same cognitive and emotional biases that influence market trends, irrespective of their financial capacity.
Although volatility has decreased in comparison to previous cycles, the increase from $15,000 to over $120,000 is far from insignificant. Importantly, Bitcoin has achieved this remarkable ascent without the extensive and prolonged drawdowns seen in earlier bull markets. The emergence of ETFs and institutional treasury acquisitions have altered supply dynamics; however, the core feedback loop of greed, fear, and speculation remains operational.
The Universality of Market Bubbles
Bitcoin is not the only asset prone to parabolic trajectories; market bubbles have persisted throughout financial history. Asset prices have repeatedly surged beyond their underlying fundamentals, driven by human behavior. Research consistently demonstrates that periods of stability often foster instability, as tranquil conditions encourage leverage, speculation, and ultimately, drastic price movements. Bitcoin has followed this established pattern, with phases of low volatility contributing to rising Open Interest, increased leverage, and heightened speculative positioning.

Contrary to the assumption that sophisticated investors are immune to these phenomena, research from the London School of Economics suggests the contrary; professional capital can exacerbate bubbles by entering the market late, driven by momentum, and intensifying price movements. The financial crises of 2008 and the dot-com collapse did not originate with retail investors; rather, they were predominantly fueled by institutional players.
The ETF flows observed during this cycle further illustrate this point. Periods marked by net outflows from spot ETFs have often coincided with local market bottoms. Instead of demonstrating precise market timing, these patterns reveal that “smart money” is just as susceptible to herd mentality and trend-following behaviors as retail investors.

Potential Catalysts for Bitcoin’s Next Surge
A closer examination of global markets reveals how capital rotation could precipitate another parabolic phase for Bitcoin. Since January 2024, the market capitalization of gold has surged by over $10 trillion, from $14 trillion to $24 trillion. For Bitcoin, which currently has a market capitalization of approximately $2 trillion, even a modest influx of capital could significantly impact its valuation due to the money multiplier effect. With around 77% of Bitcoin held by long-term investors, only 20–25% of the supply is readily liquid, establishing a conservative money multiplier of 4x. This translates to potential new inflows of $500 billion, merely 5% of gold’s recent growth, potentially elevating Bitcoin’s market cap by $2 trillion and implying prices exceeding $220,000.

Perhaps the most compelling argument for a potential blow-off top lies in the fact that parabolic rallies have already occurred within this cycle. Since the market low in 2022, Bitcoin has experienced multiple surges exceeding 60-100% within a timeframe of less than 100 days. By superimposing these fractal patterns onto current price movements, plausible scenarios suggest that Bitcoin could reach valuation levels between $180,000 and $220,000 by year-end.

Unwavering Parabolic Potential for Bitcoin
The assertion that institutional adoption has eradicated the potential for parabolic blow-off tops underestimates both the structural fundamentals of Bitcoin and the psychological factors influencing market behavior. Bubbles are not mere accidents of retail speculation; they represent a recurring phenomenon throughout market histories, frequently accelerated by institutional capital.
While market dynamics cannot guarantee outcomes, dismissing the likelihood of a parabolic top overlooks centuries of market behavior and the unique supply-demand mechanisms that position Bitcoin as one of the most reflexive assets in the financial landscape. Ultimately, the phrase “this time is different” may merely suggest that the forthcoming rally could be more dramatic, rapid, and extensive than anticipated.
For comprehensive data, charts, and professional insights into Bitcoin price trends, visit BitcoinMagazinePro.com.
WATCH LATEST BITCOIN ANALYSIS

Thank you for visiting our site. You can get the latest Information and Editorials on our site regarding bitcoins.
