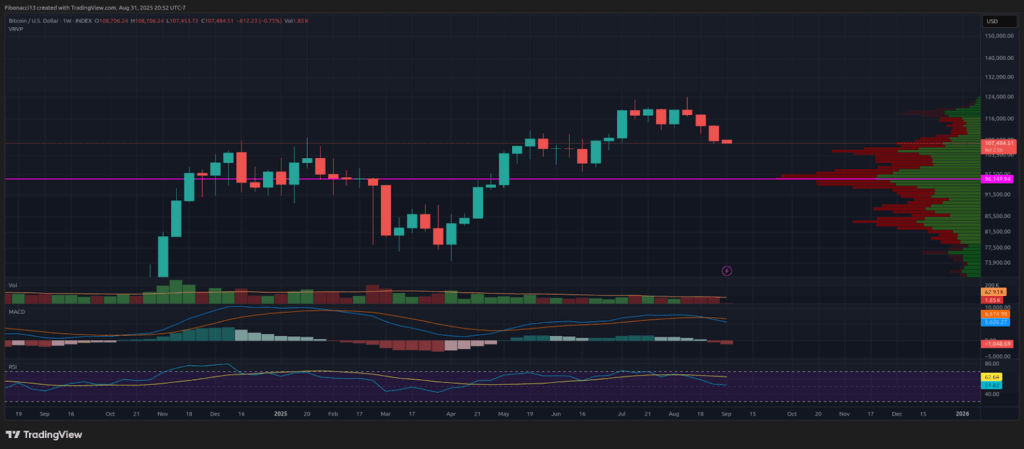
Bitcoin’s performance in August was notably disheartening for bullish investors. After achieving a new all-time high of just over $124,000 in mid-August, Bitcoin has experienced three consecutive week-long declines, evident in the weekly chart’s continuous red candle closes. The latest candle has positioned itself near the lows, indicating a clear momentum shift towards bearish sentiment.
The MACD oscillator has confirmed a bearish crossover during the weekly close, an indication that may continue to exert downward pressure as this week progresses. Meanwhile, the RSI currently sits in a neutral area just above the 50 line, yet it reflects its lowest position since mid-April.
As September unfolds, Bitcoin is anticipated to test support levels established during the May-to-June price consolidation period. Bullish advocates will be keen on the high-volume node around $104,000-$105,000 to maintain price stability and ideally avoid a weekly candle close below this threshold. Conversely, bearish traders will strive to breach this support and drive prices down to the key 1.618 Fibonacci extension level from the 2022 bear market at $102,000. A weekly close around or below $102,000 could pose significant challenges for bulls, placing the critical $100,000 “laser eyes” level in jeopardy and potentially revisiting the last major swing low at $98,000.
A decline below $100,000 would reinforce the narrative that the long-term peak has been reached. The $96,000 mark serves as the final defensive barrier for bullish investors should prices breach the aforementioned support levels.
In summary, this week presents an opportunity for buyers to intervene and instigate a reversal at the $105,000 level. Bulls are likely to seek a rebound and initiate a reversal candle to rectify current trends. However, the present market dynamics suggest that bears maintain control, likely continuing their selling pressure into September.
Terminology Guide:
Bulls/Bullish: Refers to buyers or investors who anticipate a rise in price.
Bears/Bearish: Indicates sellers or investors who expect a decline in price.
Support or Support Level: A price point at which an asset is expected to hold, at least initially. The more times an asset meets this level, the weaker it becomes, increasing the likelihood of a failure to uphold the price.
Resistance or Resistance Level: Conversely describes a point likely to reject the price, also weakening with repeated touches, making it more vulnerable to eventual breach.
Fibonacci Retracements and Extensions: Ratios derived from the golden ratio, which is relevant to growth and decay cycles in nature, based on constants Phi (1.618) and phi (0.618).
Oscillators: Technical indicators that fluctuate over time, typically remaining within specified bounds. They oscillate between low levels (indicative of oversold conditions) and high levels (indicative of overbought conditions), such as the Relative Strength Index (RSI) and Moving Average Convergence-Divergence (MACD).
MACD Oscillator: The Moving Average Convergence-Divergence serves as a momentum oscillator that calculates the difference between two moving averages to indicate trend direction and momentum.
RSI Oscillator: The Relative Strength Index, ranging from 0 to 100, measures the speed of price movements. An RSI above 70 is considered overbought, while below 30 indicates oversold conditions.
Thank you for visiting our site. You can get the latest Information and Editorials on our site regarding bitcoins.
