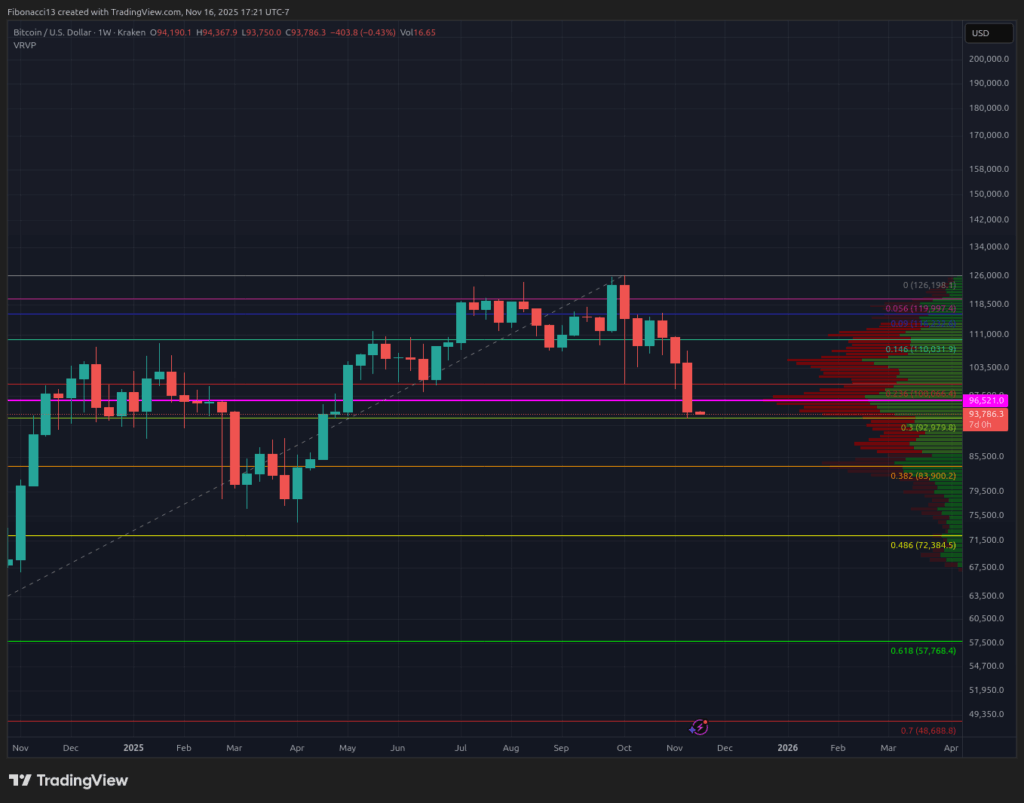
This week has brought disappointing news for bullish investors, as Bitcoin concluded the trading period at $94,290, falling short of the crucial $96,000 weekly support threshold. The prevailing sentiment suggests a continuation of bearish price movements in the forthcoming weeks, particularly as critical support levels have been breached. Although some upward bounces might occur, they are not expected to return prices to any significant levels.
Current Key Support and Resistance Levels
The price of Bitcoin has closed below the identified $96,000 support level mentioned in previous analyses. This low close leaves little, if any, opportunity for recovery or a resumption of bull market conditions in the near term. The next significant support level appears to be at the 0.382 Fibonacci Retracement from the market bottom in 2022 to the highs in October 2025, alongside a high-volume node in the range of $83,000 to $84,000. Should prices decline further, attention will turn to the 2024 consolidation zone, specifically the $69,000 to $72,000 range.
In terms of resistance, the area above $94,000 has become significantly congested. Given the current pricing, notable upward movement at this level is unlikely. Should any bounce materialize, $98,000 is anticipated to be a resistance point, with a potential short squeeze possibly enabling a rise to $101,000. Beyond this level, significant resistance exists within the $106,000 to $109,000 range, with $114,000 marking another critical barrier, followed by $116,000 as a formidable defense against bullish movements. A close above $116,000 would necessitate a reevaluation of the market structure, as it could indicate a shift towards bullish sentiment.

Outlook for the Upcoming Week
For those who hold out hope for a miraculous recovery, it is essential to assess whether a meaningful rally in Bitcoin’s price can be anticipated in the coming week. There remains a slight glimmer of optimism for bulls, as the broadening wedge pattern has yet to definitively establish a bearish break. If this pattern is extended to encompass its lowest potential, the price is barely sustained at the current lows. However, given the various outlined resistance levels, it is a formidable challenge for bullish investors to secure substantive gains. The most favorable expectation for bulls may be a bounce to $106,000, after which prices may likely decline to new lows from any position below that threshold. More realistically, the broadening wedge is projected to break downward imminently, as bearish sentiment appears dominant.

Market Sentiment: Highly Bearish – The bullish outlook appears bleak. Currently situated around $94,000, Bitcoin has experienced a decline exceeding 25% from the highs recorded in October. Few expectations remain for any substantial rally or new highs following the loss of major support levels.
Future Considerations
An examination of the four-year Bitcoin cycle theory suggests that the recent peak may have already been reached. This peak was anticipated to occur between September and December 2025; however, with current pricing and substantial overhead resistance, the likelihood of any rally sustaining sufficient momentum to establish new highs before year-end is minimal. Is the four-year cycle concluded? It seems not, as the price peaked in early October and has since encountered a significant decline. A late-stage high in the four-year cycle during the first quarter of 2026 remains a possibility, but it is increasingly improbable given Bitcoin’s recent weakness, particularly in light of a strong traditional stock market. With the stock market now presenting a bearish outlook for the foreseeable future, the prospects for Bitcoin achieving any substantial rally appear dim.
Terminology Guide:
Bulls/Bullish: Investors anticipating an increase in prices.
Bears/Bearish: Investors expecting a decrease in prices.
Support Level: A price level where an asset is expected to maintain its value, at least initially. Frequent testing can weaken this level, increasing its likelihood of failure.
Resistance Level: The opposite of support; a price level likely to prevent an asset from rising, at least initially. Similar to support levels, frequent interaction can weaken this barrier and enhance the chance of a breach.
Fibonacci Retracements and Extensions: Ratios based on the golden ratio, highlighting natural growth and decay cycles. These ratios utilize mathematical constants Phi (1.618) and phi (0.618).
Volume Profile: An indicator illustrating the total transaction volume at specific price levels. The point of control (POC) is denoted by a horizontal line on this indicator, representing the price level with the highest transaction volume.
Broadening Wedge: A chart pattern characterized by an upper trend line serving as resistance and a lower trend line serving as support, with both lines diverging as the pattern develops. This pattern indicates expanding price volatility, leading to higher highs and lower lows.
Thank you for visiting our site. You can get the latest Information and Editorials on our site regarding bitcoins.
