Weekly Outlook on Bitcoin Prices
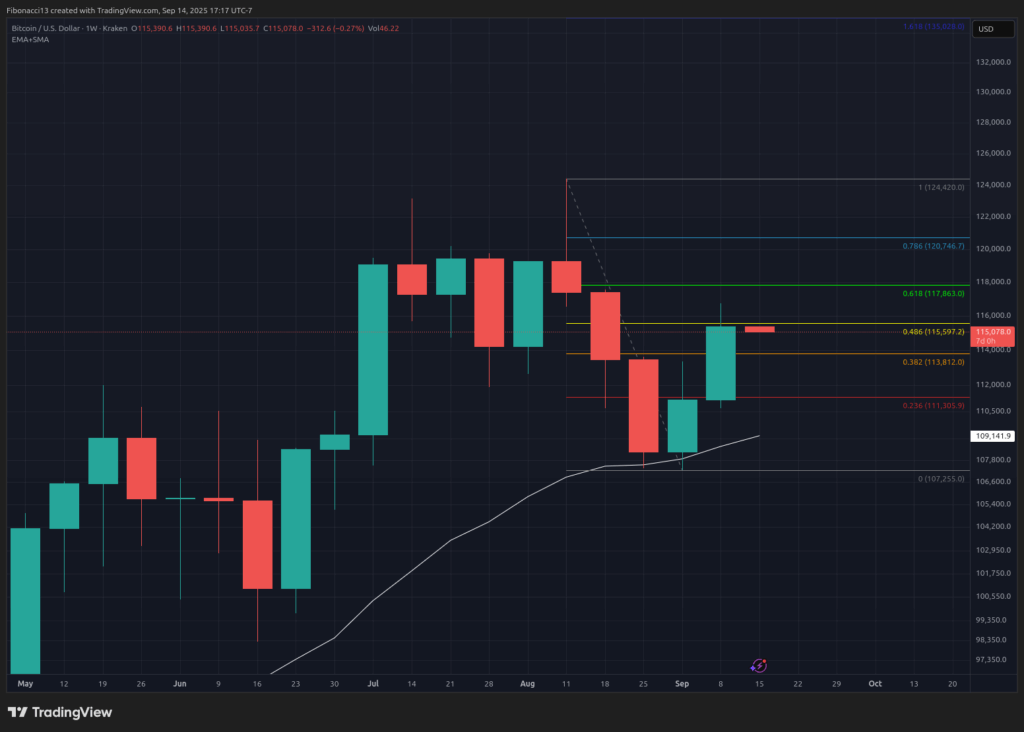
Bitcoin concluded the previous week at $115,390, briefly surpassing the $115,500 resistance level while entering the weekend. However, it subsequently retraced and ended the week just shy of that mark. The week produced a notable bullish candle, sustaining upward momentum into the current week. The U.S. Producer Price Index came in significantly below expectations on Wednesday, generating optimism among market bulls regarding a potential rate cut by the Federal Reserve. Following this, Wednesday’s inflation data showed a 2.9% reading, aligning with expectations but notably higher than the prior month’s 2.7%. The Federal Reserve faces a challenging decision at Wednesday’s FOMC Meeting, weighing the merits of a rate cut against potential pitfalls. The market anticipates a 0.25% interest rate reduction, as indicated by Polymarket; any reluctance from the Federal Reserve could precipitate a market correction.
Current Key Support and Resistance Levels
As the week commences, the immediate resistance level for Bitcoin is $115,500, with $118,000 positioned above it. Should Bitcoin achieve another strong performance, there exists potential for price levels to surpass $118,000 during the week, although a subsequent close below it by Sunday may be expected. Significant selling pressure is likely to emerge at this point, pushing bulls to relinquish some territory.
In the event of weakness this week or a rejection at the $118,000 level, attention should be directed towards the short-term support level at $113,800. Should the price fall below this threshold, weekly support is situated at $111,000. A close beneath this level could challenge the previous low of $107,000.

Market Outlook for This Week
A review of the daily chart reveals a slightly bearish bias as of Sunday’s close, following a rejection at $116,700 the previous Friday. This sentiment could quickly shift to a bullish outlook if Monday’s U.S. stock market demonstrates a return to positive trends. The MACD indicator is currently endeavoring to remain above the zero line, aiming to re-establish it as support for bullish momentum. Simultaneously, the RSI is trending downward but retains a bullish posture and may seek support from the 13 SMA should selling intensify into Tuesday.
The focus will be on Chairman Powell and the Federal Reserve during Wednesday’s announcement at 2:30 PM Eastern. Any outcome other than a 0.25% rate cut announced at 2:00 PM could generate considerable market volatility, likely impacting Bitcoin significantly.
Market sentiment: Generally bullish, fueled by two consecutive weeks of positive performance – market participants are anticipating a test of the $118,000 level this week.

Looking Ahead: The Coming Weeks
Maintaining momentum above $118,000 will be pivotal in the upcoming weeks as Bitcoin aims to overcome this significant hurdle. Should Bitcoin establish $118,000 as support, a continued ascent into the $130,000s may follow.
If the Federal Reserve does proceed with a rate reduction this week, market participants will then look ahead to October for potential further cuts. Thus, corroborative market data and continued reductions will be integral to Bitcoin’s pricing trajectory, potentially leading to a bullish continuation towards new highs.
Conversely, any substantial adverse developments, or a surprising decision by the Federal Reserve to withhold a cut on Wednesday, will likely result in a retracement for Bitcoin, testing lower support levels.

Terminology Guide:
Bulls/Bullish: Refers to buyers or investors anticipating a price increase.
Bears/Bearish: Refers to sellers or investors anticipating a price decrease.
Support or support level: A price point where the asset is likely to hold, at least initially. A greater number of interactions with support can weaken it, increasing the likelihood of a breakdown.
Resistance or resistance level: The opposite of support; a price point that is likely to suppress further advances initially. Increased touches at resistance may weaken it, making it more prone to failure in holding back the price.
SMA: Simple Moving Average, which represents the average price based on closing prices over a specified period. In the context of the RSI, it refers to the average strength index value over the designated period.
Oscillators: Technical indicators that fluctuate over time, typically within a defined range between set levels. They oscillate between a low level (often indicating oversold conditions) and a high level (often indicating overbought conditions), e.g., Relative Strength Index (RSI) and Moving Average Convergence-Divergence (MACD).
MACD Oscillator: The Moving Average Convergence-Divergence is a momentum oscillator computed from the difference between two moving averages to indicate both the trend and momentum.
RSI Oscillator: The Relative Strength Index is a momentum oscillator that varies between 0 and 100, measuring the speed of price changes. An RSI above 70 indicates overbought conditions, while an RSI below 30 indicates oversold conditions.
Thank you for visiting our site. You can get the latest Information and Editorials on our site regarding bitcoins.
