Bitcoin Price Weekly Outlook
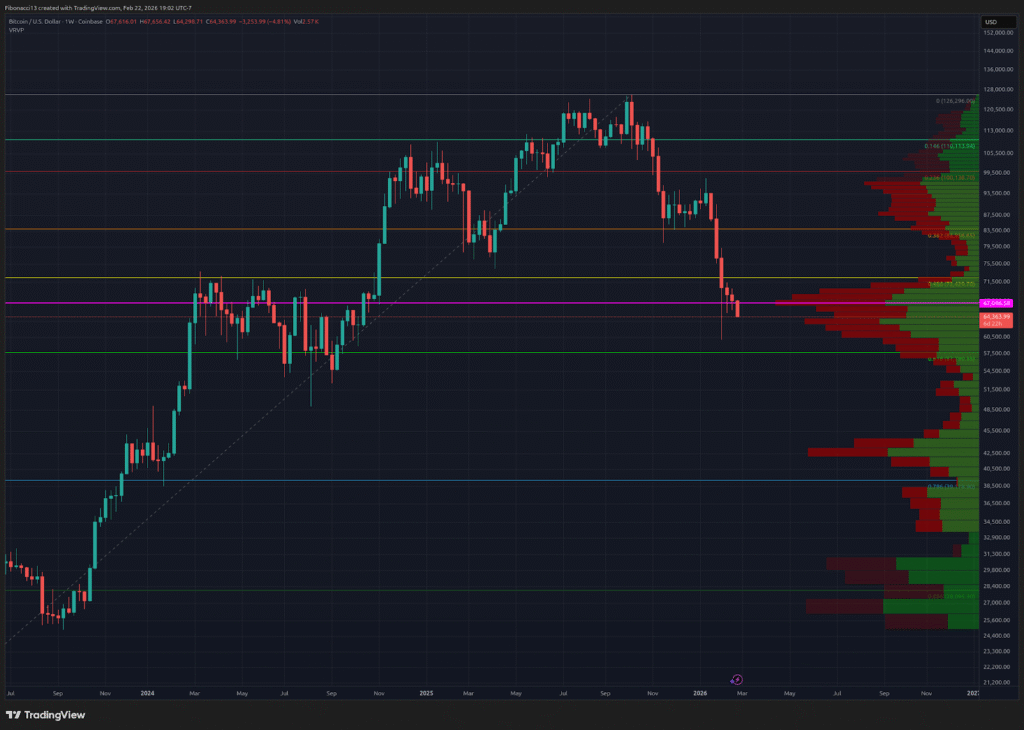
This week’s closing price for Bitcoin stands at $67,638, a performance that lacks distinction. The support level at $65,650 has maintained itself for several weeks; however, current selling pressures suggest it may be breached shortly. As of the latest observations on Sunday night, Bitcoin is trading beneath this support level at $64,600, indicating an anticipated bearish trend that may lead to a test of the $60,000 mark.
Key Support and Resistance Levels
While there exists a slim possibility for the $65,650 support level to remain intact should the price rally above it, this outcome appears increasingly improbable. The $63,000 threshold represents a critical defense line for bullish traders to prevent new lows. Although there is speculation that $57,800 could serve as a reversal point, it is also plausible that the price may decline further to $53,000 first. Should there be a weekly close beneath $57,800, the support zone between $42,000 and $44,000 could emerge as a significant long-term support area.
Given the current bearish sentiment, discussing resistance levels may seem less pertinent. The price is struggling to maintain a foothold above the critical support zone, with weekly closes necessary to remain above $67,000. Should this level be compromised, it may transition to resistance—a situation complicated by the long-term point of control (POC) now situated at this level. A significant resistance level above is established at $72,000, with the potential for the price to rise to $74,500, and possibly $79,000 thereafter.
Outlook for This Week
The start of this week shows a considerable decline, casting a pessimistic outlook for the days ahead. Although daily oscillators previously suggested a possible reversal, recent trends appear to have shifted toward bearish indicators. The Relative Strength Index (RSI) is currently positioned below the 13-day simple moving average (SMA), while the Moving Average Convergence Divergence (MACD) looks poised for a bearish crossover beneath the zero line. Both signals, if confirmed by a daily close, are expected to precipitate further declines.

Market Mood: Very bearish – The weekly candle observed in the past week shows little variation from the preceding week, continuing to project weakness and bearishness.
The Next Few Weeks
Bulls have yet to demonstrate any substantial momentum following the bounce from $60,000 three weeks ago. Weekly oscillators remain entrenched in bearish territory without indications of a reversal, suggesting a likely continuation of the downward trend. The Momentum Reversal Indicator (MRI) stands at a red 6 as the week begins, indicating potential for an additional four weeks of bearish activity unless the price can close above $77,000—a scenario that seems highly unlikely at this juncture. Stakeholders are advised to remain cautious.

Terminology Guide:
Bulls/Bullish: Individuals who are buying or investing with the expectation of price increases.
Bears/Bearish: Individuals who are selling or investing with the expectation of price declines.
Support or Support Level: A designated price point at which an asset is expected to maintain stability. Increased touches on support typically result in greater likelihood of failure to sustain the price.
Resistance or Resistance Level: The opposite of support, a price level anticipated to repel further price increases. As with support, repeated touches can weaken resistance, making it more susceptible to breaches.
Volume Profile: An indicator illustrating total buy and sell volumes at specific price levels. The point of control (POC) identifies the price level where transaction volume was highest.
SMA: Simple Moving Average. The average price calculated from closing prices over a designated period. For RSI, this refers to the average strength index over the specified timeframe.
Oscillators: Technical indicators that fluctuate over time, typically confined within predetermined levels, oscillating between regions of being oversold and overbought. Examples include the RSI and MACD.
RSI Oscillator: The Relative Strength Index, a momentum oscillator that ranges from 0 to 100, measuring the speed and change of price movements. A reading above 70 indicates overbought conditions, while below 30 signifies oversold conditions.
MACD Oscillator: The Moving Average Convergence-Divergence, a momentum oscillator that highlights trends and momentum by calculating the difference between two moving averages.
Momentum Reversal Indicator (MRI): A proprietary indicator developed by Tone Vays that tracks buying and selling momentum, providing signals to anticipate when momentum may wane or accelerate.
Thank you for visiting our site. You can get the latest Information and Editorials on our site regarding bitcoins.
