Weekly Outlook for Bitcoin Price
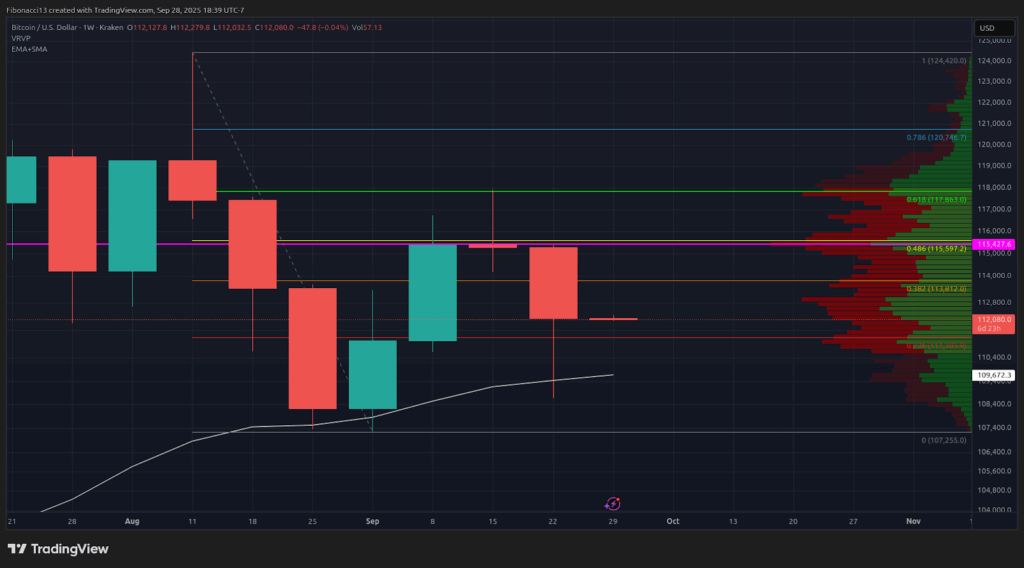
The analysis from the previous week indicated a significant decline in bitcoin’s value, plummeting to $111,800 last Sunday evening. The price subsequently rebounded, retesting the $113,800 resistance level and the 21-day EMA at $114,000. However, it faced rejection at this level and fell back to the $111,300 support zone. This level allowed for another upward movement, with bulls again testing the 21-day EMA but failing to surpass the $113,800 resistance. By Thursday, the price dropped just below the weekly support at $109,500. Ultimately, it rallied from this low, concluding the week at $112,225.
Current Key Support and Resistance Levels
With the price closing above the 21-week EMA at $109,500 to end the week, the bulls are likely to consider this support level pivotal going forward. A maintenance of $109,500 should serve as a foundational support as bulls aim to establish a higher low this week. Should this support falter, the next visible support level stands at $105,000, with the potential for a notable reversal down to approximately $102,000. If the price were to dip below $102,000, significant long-term support at $96,000 may come into play.
Conversely, should the bulls manage to close above the $115,500 resistance level, this could help to re-establish the current upward trend. Achieving such a close would likely instill confidence necessary to challenge the $118,000 resistance yet again, with $121,000 identified as a critical threshold towards reaching new highs. However, this level may not remain stable for long if there is a weekly close surpassing $118,000.

Market Outlook for the Week
This week may witness a retest of the $109,500 low, with a potential to validate this level as support, facilitating a bullish movement back towards $113,800. Given the current market dynamics, it is unlikely that a significant upward push will occur without robust buying pressure—hence the $115,500 resistance level should remain a challenge if the $113,800 level is successfully breached. The bulls will aim to establish a bullish candlestick formation this week to confirm the prior week’s action as a higher low.
Despite these indications, the weekly chart retains a bearish bias. Therefore, it would be prudent to expect the $113,800 resistance level to persist in the short term. Should the price fall below $109,500, it could result in another substantial decline, testing support levels between $105,000 and $102,000.

Market Sentiment: Bearish — The significant red candlestick to close out the week indicates that bears are firmly in control. The bulls will face considerable pressure to mount a robust defense of the 21-week EMA support level this week.
Looking Ahead
The weekly chart remains bearish until definitive evidence suggests otherwise. Bulls must actively work to shift this bias in their favor to incite positive price movements moving forward; a strong close this week could facilitate this transition. Following September’s interest rate cut, the market will be keenly observing for further cuts in the upcoming October and December FOMC meetings to maintain capital influx. Investors will closely monitor U.S. financial reports over the coming weeks for indications supporting additional cuts. Any setbacks in this regard could likely exacerbate bearish sentiment and incite further selling.
Terminology Guide:
Bulls/Bullish: Referring to buyers or investors who anticipate a rise in price.
Bears/Bearish: Referring to sellers or investors who expect a decline in price.
Support or Support Level: A price level at which an asset is expected to stabilize, at least initially. The more frequently an asset tests this level, the weaker it becomes, increasing the likelihood of failure.
Resistance or Resistance Level: The opposite of support; a price level likely to impede upward price movement initially. Similar to support, the more frequently an asset tests resistance, the weaker it becomes, increasing the likelihood of breaching this level.
EMA: Exponential Moving Average. This type of moving average gives more weight to recent prices, thus reducing the lag typically associated with moving averages.
Thank you for visiting our site. You can get the latest Information and Editorials on our site regarding bitcoins.
