Amidst the prevailing focus on the potential highs that Bitcoin could achieve in the current bull market, it is equally crucial to contemplate the subsequent market movements. This analysis will examine the data and mathematical frameworks that can assist in estimating the potential low during Bitcoin’s next bear market. Such estimation is not intended as a prediction but rather as a structured analysis based on historical cycles, on-chain valuation metrics, and fundamental valuations of BTC.
Table of Contents
- Cycle Master: Modeling Historical Bitcoin Price Bottoms
- Diminishing Drawdowns: Why Each Bitcoin Price Bear Market Hurts Less
- Forecasting the Next Bitcoin Price Top and Bottom
- Bitcoin Price and the Rising Cost of Production
- Conclusion: The Next Bitcoin Price Cycle Will Likely Be Shallower
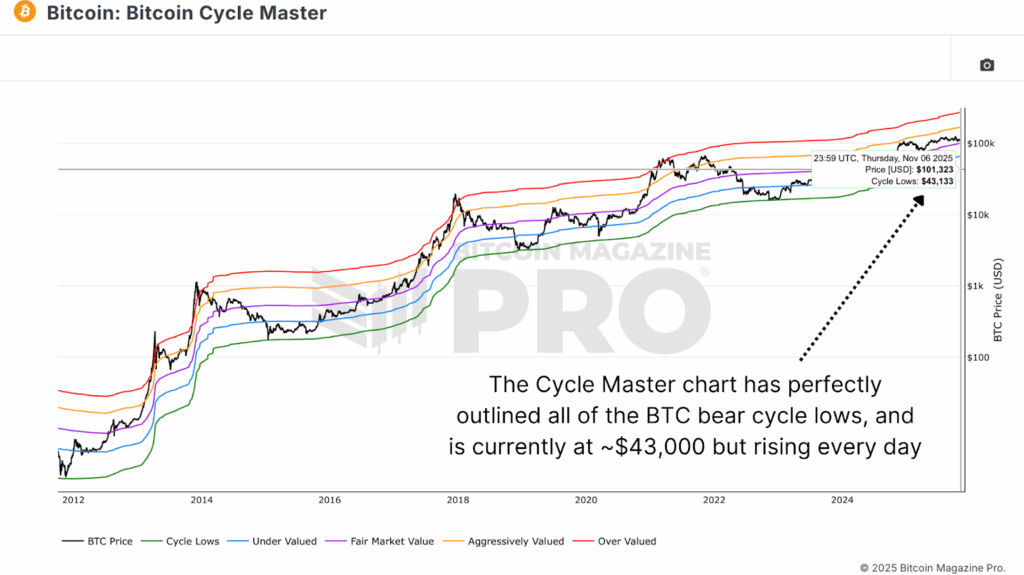
Cycle Master: Modeling Historical Bitcoin Price Bottoms
A notable model for identifying Bitcoin’s cyclical lows is the Bitcoin Cycle Master chart, which synthesizes various on-chain metrics to delineate price bands at specific valuation levels.
Historically, this green “Cycle Lows” line has accurately identified Bitcoin’s macro bottoms, ranging from $160 in 2015 to $3,200 in 2018, and subsequently at $15,500 in late 2022. Currently, this band hovers around $43,000 and increases daily, serving as an essential baseline to estimate potential declines in the forthcoming cycle.
Diminishing Drawdowns: Why Each Bitcoin Price Bear Market Hurts Less
An additional metric to consider is the raw MVRV Ratio, which gauges Bitcoin’s market price in relation to its realized price (the average cost basis of all coins). Traditionally, during pronounced bear markets, Bitcoin tends to decline to approximately 0.75x its realized price, indicating that the market price trades about 25% below the network’s collective cost basis.

This pattern provides a compelling anchor for estimating potential downside when combined with the trend of diminishing drawdowns. Bitcoin’s early cycles experienced declines as steep as 88%; however, this figure has progressively compressed to 80% in 2018 and 75% in 2022. Extending this trend suggests that the next bear market may induce a retracement of approximately 70% from cycle highs.

Forecasting the Next Bitcoin Price Top and Bottom
Prior to estimating the next low, it is essential to establish a plausible assumption regarding the potential peak of this bull market. Historical MVRV multiples and slope-trended realized price growth indicate that Bitcoin has recently tended to peak at roughly 2.5 times its realized price. If this relationship persists and the realized price continues its upward trajectory, it implies a possible peak near $180,000 per BTC by late 2025.

If that assumption holds true, and Bitcoin adheres to its historical one-year bear market lag into 2027, a 70% retracement from that peak would position the next significant cycle low around $55,000–$60,000, contingent on the realized price trajectory at that time. Notably, these figures also correspond with Bitcoin’s consolidation range from the previous year, thus providing additional technical confluence.
Bitcoin Price and the Rising Cost of Production
A highly dependable long-term valuation metric for Bitcoin is its production cost, specifically the estimated electrical expense required to mine one BTC. Historically, this metric has closely aligned with Bitcoin’s most profound bear market lows. Following each halving event, the production cost approximately doubles, establishing a progressively rising structural floor beneath the price over time.

When Bitcoin trades below its production cost, it signals potential stress for miners and typically coincides with significant accumulation opportunities. Following the April 2024 halving, the new cost basis increased sharply, and historical trends indicate that when Bitcoin dips near or slightly below this threshold, it has marked local bottoms followed by sharp reversals. Currently, this value approximates $70,000, although it fluctuates regularly.
Conclusion: The Next Bitcoin Price Cycle Will Likely Be Shallower
Each Bitcoin cycle has been accompanied by narrative claims asserting, “This time is different.” However, the data persists in demonstrating otherwise. Despite the increased institutional adoption and broader financial integration that have transformed Bitcoin’s structure, its inherent cyclicality remains unchanged.
The data indicates that the forthcoming bear market will likely be less severe, reflecting a more mature and liquidity-driven environment. A retracement toward the $55,000–$70,000 range would not signify a collapse; rather, it would represent the continuation of Bitcoin’s historical rhythm of growth and reset.
For a more comprehensive exploration of this topic, viewers are encouraged to watch the recent YouTube video: Using Math & Data To Predict The Bitcoin Bear Market Low.
For deeper data, charts, and professional insights into Bitcoin price trends, visit BitcoinMagazinePro.com.
Thank you for visiting our site. You can get the latest Information and Editorials on our site regarding bitcoins.
